
For More Posts like this Visit GeoWedge
HISTORY:
 In the late 1980’s Schlumberger introduced the concept of borehole electrical images by processing variations of the shallow microresistivity of wellbore walls recorded by modified versions of its Stratigraphic High Resolution Dipmeter Tool™. Called the Formation Micro-Scanner™ (FMS), the tool measured closely spaced arrays of focused shallow resistivity readings that are related to changes in rock composition and texture, structure, and fluid content [Serra, 1989]. Processing the data, in which a range of colors are assigned to the lateral (side-to-side) and vertical variations of the microresistivity along the wellbore, produces an image of the borehole wall.

FMI ADVANTAGES:
 In the late 1980’s Schlumberger introduced the concept of borehole electrical images by processing variations of the shallow microresistivity of wellbore walls recorded by modified versions of its Stratigraphic High Resolution Dipmeter Tool™. Called the Formation Micro-Scanner™ (FMS), the tool measured closely spaced arrays of focused shallow resistivity readings that are related to changes in rock composition and texture, structure, and fluid content [Serra, 1989]. Processing the data, in which a range of colors are assigned to the lateral (side-to-side) and vertical variations of the microresistivity along the wellbore, produces an image of the borehole wall.
WHAT DOES FMI MEASURES:
Image logs are resistivity or acoustic devices that measure certain physical properties of the rock at or near the well that can be displayed as images of the wellbore, which can then be interpreted on a computer. Typically rock properties are controlled by factors such as variations in composition, diagenesis, grain size, grain orientation, pore fluid variations, etc. Image logs can provide detailed picture of the wellbore that represent the geological and petrophysical properties of the section being logged.
WORKING PRINCIPLE:
The current generation of tools, called the fullbore Formation Micro Imager™ (FMI), records an array of microresistivity measurements from 192 sensors on eight pads mounted on four orthogonally placed caliper arms. The spacing and position of the pads provides 80% coverage of an eight-inch diameter hole and a resolution of 5 mm. Other oil field wireline service companies have since developed similar high-resolution electrical borehole imaging tools. The FMI yields a continuous, high-resolution electrical image of a borehole (color-coded for resistivity values), and therefore complements whole cores cut in the same well.
CORE AND FMI:
If the FMI-derived image is of sufficient quality and calibrated against the core, it can provide a continuous survey of the formation in places where core is not cut, there was no core recovery, or when a core has beendamaged through handling, transportation, or plugging.
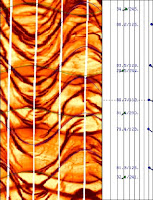
In the figure FMI image of the 60 ft section representing a Core . On the left, a
dynamic FMI image, on the right, a “Core View” simulating a core. The FMI
color scale presents a range of resistivities from conductive (black) to
resistive (white)
dynamic FMI image, on the right, a “Core View” simulating a core. The FMI
color scale presents a range of resistivities from conductive (black) to
resistive (white)
FMI ADVANTAGES:
Determine net pay
The FMI fullbore formation micromager gives you microresistivity formation images in water-base mud. This is the preferred approach for determining net pay in laminated sediments of fluvial and turbidite depositional environments.Visualize sedimentary features to understand structure
Sedimentary features features define important reservoir geometries and petrophysical reservoir parameters. The interpretation of image-derived sedimentary dip data helps you understand sedimentary structures.Interpret seismic sections
Well-to-well correlation is difficult in deviated wells with sections of steep and varying structural dip. Greatly improve your structural interpretation of seismic sections with high-quality bedding dips to compute accurate logs of true stratigraphic thickness.Get more data
Geological information from FMI borehole images helps with stochastic modeling of the sand-shale distribution. FMI images define channel heights superbly in amalgamated units. Other variables, such as the channel width and channel sinuosity, can be estimated using geological analogs, based on detailed sedimentological analysis of FMI image data.Improve well construction plans
Borehole images improve your mechanical earth models, which in turn helps you optimize well plans. Better understanding of borehole stability can save you millions of dollars during field development.Benefits
- Obtain accurate pay estimates
- Interpret formations accurately
- Improve reservoir descriptions
- Make decisions on site
- Get data in difficult environments, including deviated and horizontal wells
- Save time and money with complete interpretations in one image pass

